
By Richard Morey
September 2023
 Recession or Soft Landing?
In the words of Shakespeare, “that is the question”. Will we have a “soft landing” in which the economy slows but not into outright contraction, or a bona fide recession? This is one of the most important issues investors have ever faced. If we pay attention to the financial media these days, we are being told the only two possible outcomes are:
1. A soft landing, or
2. A recession so mild it barely registers as a problem.
The mainstream opinion has been bolstered throughout 2023 as we still haven’t formally entered a recession – mild or otherwise – at least in the data used to spot a recession. For the first 9 months of last year, as stocks were falling over 20%, inflation was roaring and the Fed was aggressively raising interest rates, the consensus was that a recession was likely right around the corner. Since it hasn’t yet arrived, those concerns are now yesterday’s news.
Not so fast. There are many causes of recessions, most of which are clearly evident today. But there is one situation which has been a remarkably reliable precursor to a recession for more than 70 years. It’s called an inverted yield curve. This summer it inverted more than any time since 1981.
What’s the yield curve again?
This is a curve that illustrates how much interest bonds of different maturities are paying. In normal times, short-term bonds pay less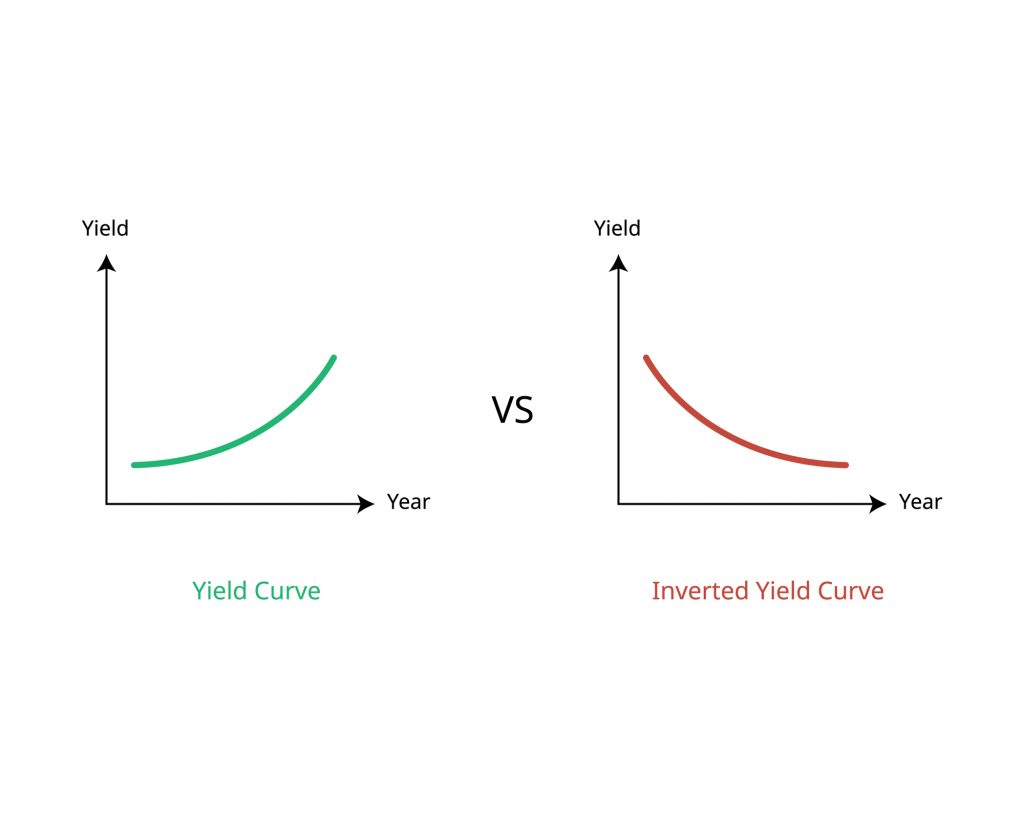 interest because they have less risk than longer-term bonds. Put in a different way, longer-term bonds must offer a higher interest rate to attract buyers. Why? If you own a long-term bond and interest rates rise dramatically in the open market, you’re stuck with a bond paying lower rates than the market for a long time. In contrast, with a short bond there is a correspondingly brief interval between purchase and maturity (payback).
An inverted yield curve means things are turned upside down, and you earn LESS interest on bonds you plan to hold longer. This means exactly one thing – long-term growth is expected to fall. The Fed is good at controlling short-term rates, which have now been driven from near zero to over 5%. But it doesn’t control long rates, and an inverted yield curve means the bond market is looking further down the road and expecting the economy, and interest rates, to fall. It expects the Fed to push the economy into recession, thereby ending our current inflationary concerns and leading to lower interest rates.
Why do we care about this?
Institutional investors, insurers, and other dominant participants in the $51 Trillion US bond market are key players in determining the yield curve by placing their bets based on a massive amount of collective research. An inverted yield curve in U.S. Treasuries has preceded all recessions in the last 70 years. The following chart from the St. Louis Fed shows the yield curve of the 2-year versus 10-year Treasury bond. If we had a similar chart showing the entire bond market, i.e. from 90 days to 30 years, we would see that, in July, it inverted more than it did even in the 1980-81 plunge.

Note that raising interest rates alone does not assure a recession. Several times since 1978 we’ve seen the Fed raise rates, but if the yield curve didn’t invert there was no recession. Last year this topic was discussed almost daily in the financial media. But the recession never arrived, so this year investors have been given the all-clear signal to proceed with risk-on.
One little problem – the time lag
Unfortunately for our economy, if you look at the chart above, you can see that the blue line fell below zero some time before the recessions which are indicated by the grey shaded areas arrived. Specifically, the shortest time between yield curve inversion and recession was 11 months in 1981, while other times it took 2-3 years. Averaging it out, we see a 17-month time lag is the average amount of time from inversion to recession.
The Fed first raised rates last March, which happens to be 17 months ago. This is one reason why many analysts who work with this data have been saying we should brace ourselves for what may come this fall. I suppose the fact it takes this long for inversion to lead to recession is why the media and investors have so fully discounted the recession risk this year. They paid attention for almost a year before moving on.
 Escape Velocity for Bonds
Once upon a time (17+ years ago), the idea bonds could experience something called “escape velocity” made sense. The concept is pretty simple. Bonds pay interest, and they go up or down in price until they mature (at the exact same price at which they were issued). Prices go up when interest rates go down, and they go down when interest rates rise. Escape velocity occurs when the annual interest the bond pays exceeds the maximum amount the bond could lose in price if rates shot up.
Clearly, reaching full escape velocity is a great situation to be in because there is then no risk of loss due to the biggest bond market risk called rising interest rates. And now, for the first time in a long time, high-quality, short-term bonds have reached it. This describes, not coincidentally, nearly all the bonds we are invested in today. Yes, daily prices do go up and down, but the roughly 6% in interest our bonds are paying should fully offset any price risk we could face. (Of course, we also own enough in managed futures to provide additional support should the Fed continue to raise rates.)
Keep in mind our bonds still have the potential to rise in price. The moment the stock market and related “at-risk” assets start falling, high-quality bonds are almost certain to rise in price – adding to the 6% in annual interest they’re paying.
When will that moment come???
Over the years, the fact this question cannot be answered by mere mortals has been proven almost daily. To quote the late MIT economist Rudiger Dornbursh, “The crisis takes a much longer time coming than you think, and then it happens much faster than you would have thought.”
With this fact in mind, everything is lined up for this fall to be the time when the (basically inevitable) financial crisis comes home to roost. However, from an investment standpoint, Secure Retirement is in no way dependent on this to occur – now or ever. Should it continue to take longer for asset prices to return to the norm, we’ll receive steady, competitive interest income while we wait. When that day finally arrives, you should see the extra profits in your account that high-quality bonds and managed futures typically provide.
Conclusion
Even though we sold Dr. John Hussman’s mutual fund last month due to the fact it continued to drop as stocks were rising, it would be unwise to dismiss his research and what it means for markets – especially the stock market. Along with confirming stocks still need to fall 65% to reach the best definition of “fair value,” today he published the following:
“The real problem is that a decade of experimental distortion (in monetary policy) encouraged unprecedented speculation in every conventional asset class, not to mention fringe speculation in assets detached from any standard of value, including meme stocks, pictures of bored monkeys, and digital Pokémon posing as “currency.” As with every similar episode across history, the unwinding of this bubble in the form of financial crisis is already quietly baked in the cake.”
In closing, I’d like to discuss the idea any recession we might have will, according to consensus, be so mild that only those already poor will notice it. Really? The two most destructive types of recessions are those caused by inflation and those caused by too much debt. The 1981-2 recession caused by inflation was the worst since the Great Depression. It was, however, eclipsed by the 2008-9 recession caused by too much (mortgage) debt.
This time around we have both of these problems at the same time. Given all the uncertainties the world economy faces today, it’s not possible to know just how difficult the coming recession will turn out to be. The idea it will be mild, on the other hand, seems highly unlikely.
Unfortunately for the stock market, nosebleed valuations lead to huge price drops even if we have a mild recession. The poster child for this occurred during the 2001-2 “dot.com” tech stock bubble. The recession that kicked off that bubble popping was mild, yet stocks fell all the way back to their “fair value.”