
By Richard Morey
June 2023
Monetary Policy and It’s Impact on the Economy & Markets
The recent past:
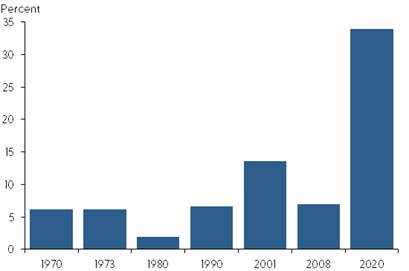
Our first chart shows Congress responded to the pandemic recession by sending out more money to businesses and consumers than ever before – in fact, we spent four times as much as normal.
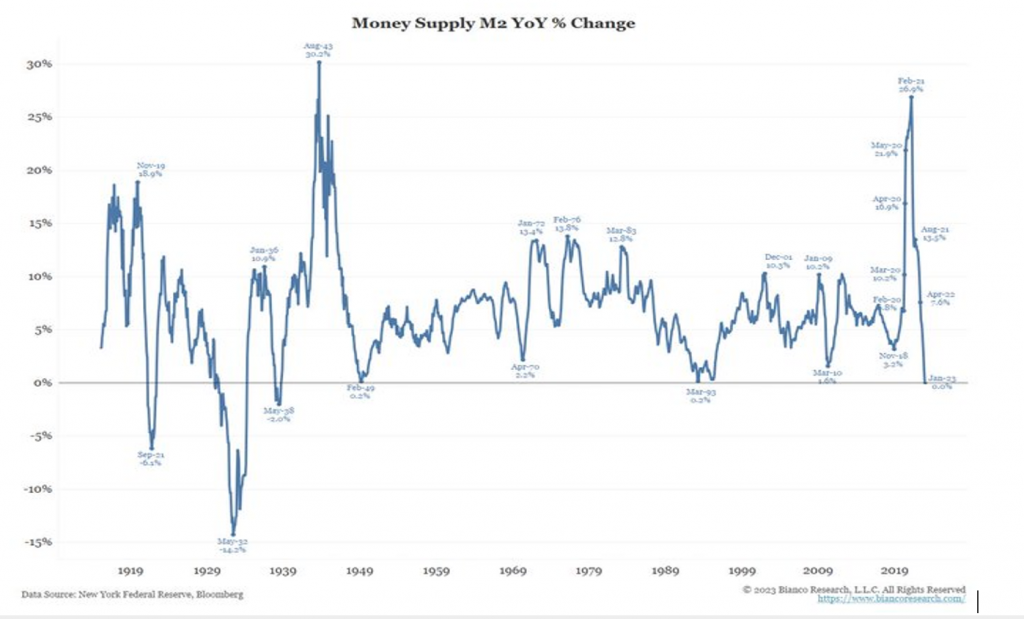
An updated close-up of that chart would show that the money supply is now dropping for the first time since 1937. Since the money supply almost never contracts, there isn’t much research on this topic. Here’s what we do know.
- First, we’ll define how the money supply rises or falls. Banks are the largest contributor to changes in the money supply. When someone deposits money in a bank, the money supply doesn’t change. However, when banks then loan that money out, the money supply increases. In fact, every new loan increases the money supply, while every retired loan decreases it.
The other cause of changes in the money supply comes directly from the Fed. Among other activities, quantitative easing and tightening through the sale or purchase of bonds from the banks directly moves the money supply. The Fed spent years buying bonds from the banks, thereby replacing one asset called bonds with another called cash. Now the Fed is doing the opposite as they sell some of what was previously purchased, or simply let it expire. When the bonds are sold or mature, the money is returned to the government and “retired.”
- On his deathbed, former Fed Chairman Paul Volcker – who defeated inflation at the end of the ‘70’s and beginning of the ‘80’s – said the greatest lesson from his inflation fight was that reducing the money supply was the single key to stopping inflation. When the money supply rises dramatically, inflation follows. When it drops dramatically, inflation falls. Looking back at the chart, you can see why forward-looking economists are now concerned not about inflation but recession.
Unfortunately for the economy, the best economists (especially the towering authority named Dr. Lacy Hunt) recognize that inflation is falling but not dead yet. History has shown that central banks who take their foot off the brakes too soon and reverse course from monetary tightening to stimulus often fall right back into even worse inflation. As a result, the Fed is likely to keep raising interest rates and/or withdrawing money from the financial system even as the economy falls further into recession.
- Economic growth can be accurately calculated by multiplying the rate of growth of the money in our system times the velocity of money. With money growth in negative territory and velocity near a 65-year low, this means the U.S. economy is in recession today.
The obvious question is why the GDP numbers were still positive in the first quarter of this year? The answer remains one word: employment (rather, it’s actually the way employment is being calculated) . This is the variable which moves last; in fact, it never turns down significantly until we’re fully in the midst of a recession. At this point in time we see nearly everything else, including real personal income, industrial production, capital expenditures, business sales, and transportation, falling. Services were holding up but are also weakening now. A drop in employment is only a matter of time.
- Accelerations and decelerations of the money supply are destabilizing, leading to higher highs and lower lows – in both the economy and markets. To quote Dr. Lacy Hunt, “The Fed has often boomed booms and slumped slumps. They have made expansions more inflationary and recessions deeper and longer lasting.”
As proof, Dr. Hunt points to the results of numerous studies showing how huge increases and decreases in the money supply lead to deeper and longer lasting recessions. We should soon know if he turns out to be, once again, correct.
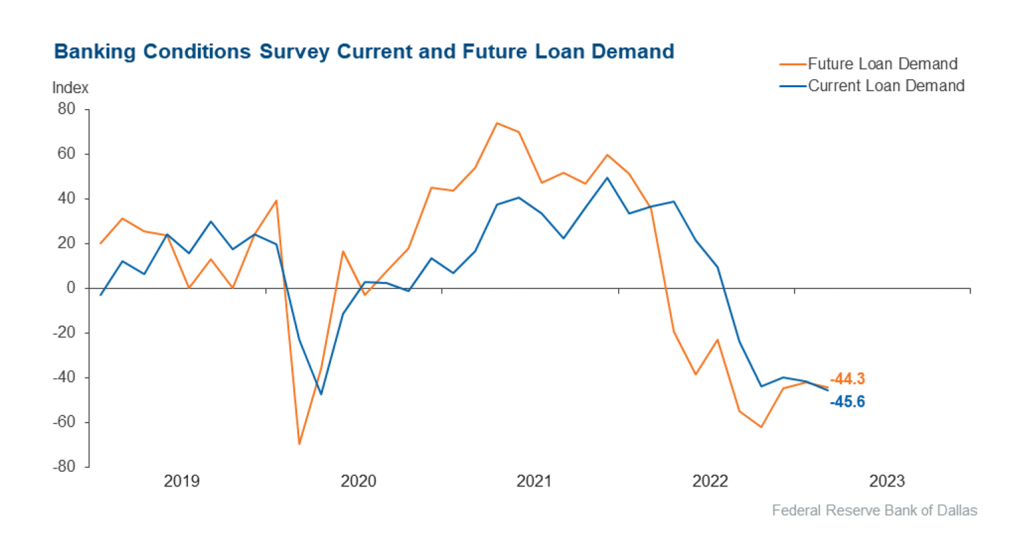
- Finally, there is one thing which was certain to occur when the money supply began to contract. Over a year ago, Dr. Hunt wrote: The contraction in money supply coupled with a rise in interest rates has reduced the desire of banks to lend and the desire of businesses and individuals to borrow.
And below you can see what has happened to bank lending, which has dropped 45%, since inflation began to damage the economy.
The Future
Both accounting identities and all the leading indicators say we’re in the early stages of the recession which always follows inflation. Could anything stop this recession in its tracks? Yes. Congress could put it off for some number of months or quarters if it approved $2+ trillion in new government stimulus programs. However, anyone who just observed how Congressional Republicans fought to cut spending in order to approve raising the debt ceiling knows there is no chance they would approve spending trillions more on consumers at this time.
This just leaves the Federal Reserve Board to try to save the day. If they again flooded the financial system with cash – starting tomorrow – they very likely could overcome the current drag on economic growth. However, this would also reignite runaway inflation.
In other words, Congress is now completely out of the game, and the Fed is in a position of “rock, meet hard place.” If they try to re-stimulate the economy, inflation is likely to get out of control; if they don’t, that harder, longer recession ensues.
Most importantly, when you begin with a debt bubble and then add inflation to the recipe you get the bursting of that debt bubble. This is a near certainty. Determining the severity of the coming debt liquidation event (which is what happens when all the embedded debt losses come to the surface and are recognized) is nearly impossible since over half of all our corporate debt is in the “shadow banking” system, i.e. cannot be accounted for until it goes bad. But the fact we can’t see all the debt doesn’t lessen its danger to the economy.
Conclusion
For the last 18 months, I have repeatedly noted that inflation damages everything it touches. Even worse, it’s nearly impossible to see the damage because inflation is camouflaged as “growth,” i.e. higher dollars of sales, higher salaries, and – in the beginning – higher corporate profits. But it isn’t real growth because the moment you subtract the impact of inflation you see the economy is producing less and everyone has less real wealth.
Most concerning of all is the research showing how extreme changes in the money supply lead to recessions which are especially severe and long. For the last year I must have heard two hundred analysts on financial television debating as to whether we’ll have 1) an unusually mild, short recession, or 2) no recession at all. No research or evidence is used to make these predictions. Instead, they’re simply hoping things turn out ok.
Hope is not the way to manage the economy, or an investment portfolio.