
By Richard Morey
April 4, 2024
 Inflation Update
As the 2nd quarter begins, it appears as if persistent inflation may end up pushing the economy, and the stock market, down as hard as I’ve been suggesting in these reports for some time. That being said, there is a large amount of data supporting the exact opposite idea that inflation will instead continue to fall. In this report I’ll attempt to describe how both may be correct.
The first two charts presented below, showing the positive and negative views, are both from the Bureau of Labor Statistics (BLS). Along with the Bureau of Economic Analysis or BEA, these are the government agencies tasked with computing inflation. The BLS, BEA & Fed have numerous ways of computing inflation. In this report we’re only using the most commonly used CPI (Consumer Price Index) – with and without food and energy.
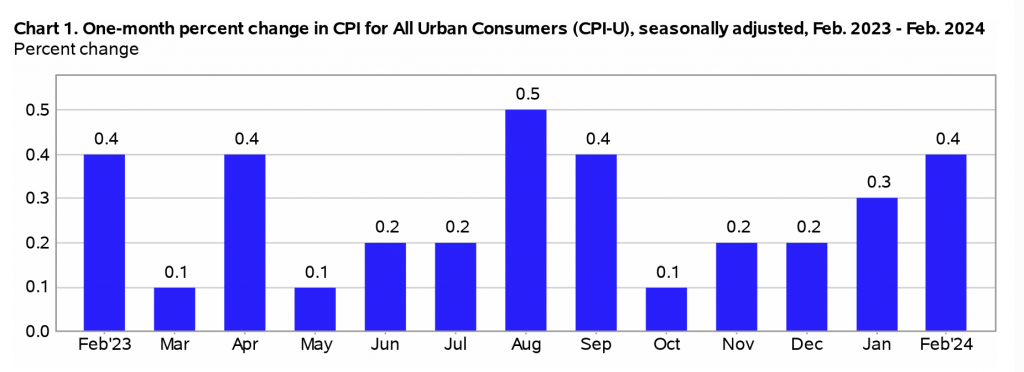
You will note that the first chart shows inflation falling sharply in 2023 and now steadying out, while the second shows inflation rising for the last 6 months. The difference is due to the first being seasonally adjusted while the second chart doesn’t use seasonally adjusted numbers. This highlights the difficulty of predicting the path of inflation through contradictory data.
I’m aware that the FED focuses on the inflation measure called PCE – Personal Consumption Expenditures. (In fact, the Dallas Fed’s “Trimmed Mean PCE” is the single best measure of inflation.) It’s essentially measuring total business & consumer spending. The FED has shown it is more accurate than CPI.
In this article, we use CPI because most economists focus upon that number, and do their analysis based upon it. Since my understanding of inflation comes primarily from economists’ analysis using CPI, that’s the best number for me to use. They all measure the same thing, and most recently PCE was at 4.1%, while CPI (excluding food and energy) was 3.8% – in other words they tend to be close to each other.
The Positive View – Inflation is Falling

The Negative View – Inflation is Rising
My concern is quite simple, and it’s basically summed up in the following graph from the BLS. On a monthly basis (seasonably-adjusted), CPI has been rising since last October. If it stays at February’s rate for the next year, inflation would rise 4.8% in a year. That’s far too much. Plus, a 5-month trend of increases has to cause any objective person to be concerned inflation might be on the rise again.
More evidence for the negative view on inflation is recent history. From 1972-1974 inflation rose from 3.4% to 12.2%. It was down to 4.8% by 1976, and the Fed proceeded to lower interest rates. It then shot up to 12.5% in 1980. It was finally crushed when Fed Chairman Paul Volcker raised short-term rates to nearly 20% by 1980. An important point to remember involves the fact they changed the calculation for inflation in 1980 – if we measured it the way we did before 1980 we would see our inflation rate peaked not at the 9% calculated in 2022 but over 12% like it was in 1974.
This fear of a double-dip in inflation may not materialize, but if it does our economy and markets are in trouble.
Alternatively, we could get off easier but still see it persistently far higher than a great majority of our consumers can financially withstand. Whether inflation rises another 3%, 5%, or 8% over the next year, a large swathe of our consumers can’t afford more increases without either falling into poverty or further into poverty. Even those making solid six-figure incomes are now also feeling some pain. This is surely due in part to the large price increase in the restaurant dining sector of GDP, in addition to airline transportation, categories that disproportionately affect the higher income groups.
Another bullet – or rather nuclear bomb – is in the chart below. This is from the Congressional Budget Office (CBO). Keep in mind as you look at this graph that the CBO is always overly-optimistic in their projections – meaning the deficits always end up being far higher than their projections. This is scary, because what they now show is our government debt started to shoot up over the last 15 years and is going to continue as far as the eye can see, reaching nearly 175% of GDP in another 25 years. Did I mention they are always overly-optimistic when it comes to these numbers?
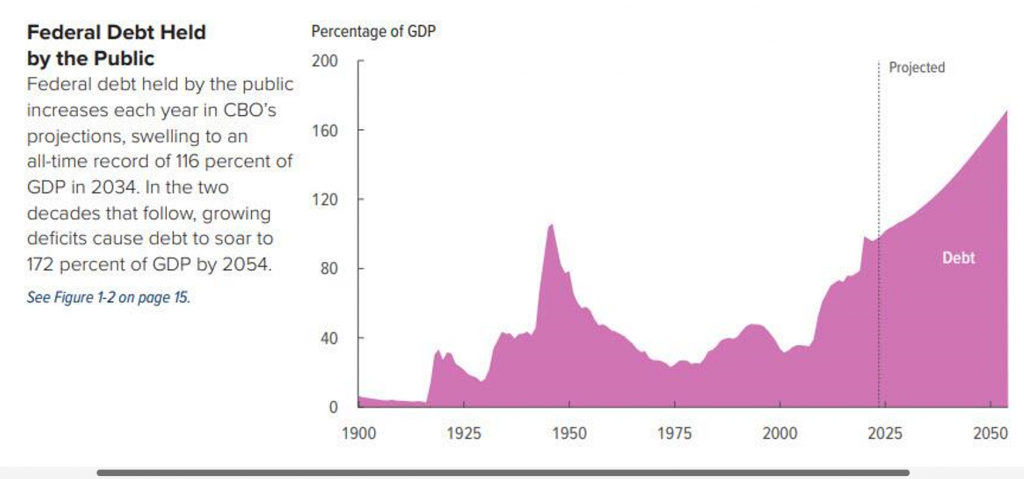
Why show this chart in a discussion of inflation? Because throughout history, when a country’s government debt began to go parabolic and exceeded approximately 125% of GDP, they’ve always ended in hyper-inflation due to severe currency devaluation. Every single time in the last 700 years – with one glaring exception. Yes, Japan with their current debt-to-GDP of 165% is the one exception. Perhaps we’ll be the second?
I have often looked at the question as to whether or not we could be the second country to “get away” with debt-to-GDP far above 125%. This is out of the 200 or so examples of over-indebted countries over the last 700 years (see This Time is Different – 700 Years of Financial Folly by Carmen Reinhart and Kenneth Rogoff).
The Japanese Mystery
My answer as to whether we could end up being the second has always been, “not likely.” Japan is unique in ways that don’t apply to any other economy in the “700 years of financial folly study.” While the outcome has always been essentially the same for all the other over-indebted countries – hyper-inflation and economic collapse – Japan’s unique circumstances appear to have removed them from normal debt-level confines.
In Japan’s case, they are the one example in which universally shared patriotism appears to make it so they don’t actually have a bond market – and haven’t for several decades. In Japan everybody knows they have no intention of ever paying back the money. Instead, just so nobody ever sells a bond, the prices of their bonds can never go down. And just so all the old debt is replaced by new debt, i.e. the entire population keeps putting the bulk of their money back into government debt, that debt doesn’t lead to a financial crisis. Instead of crisis, they just roll over all the debt all the time – thus proving the old bond market saying, “A rolling loan gathers no loss.”
But their economy hasn’t been able to grow, and Japan had little to no economic growth, and many recessions, for 31 years, from their bubble peak in 1992 through 2023.
Most recently Japan was also in a unique position in that they just got out of over 20 years of deflation as inflation struck the entire world. In Japan’s case, the head of their Central Bank brags about the fact they have finally slayed the dragon called deflation. During this entire time period, their stocks made nothing. But now with 2.8% inflation, growth is returning to their corporations and stock market.
If we’re not Japan, what happens to us as our debt soars?
While the US doesn’t have a population in which every single person will put, and keep, their money in government debt, we have had one  unique asset allowing us to be more profligate than countries in the past. This is called the US dollar’s status as the world’s reserve currency. Connected to our government bond status as the world’s ultimate “flight-to-safety,” thus far we have had no problem rolling over and increasing our debts year after year.
The question then becomes, will the US dollar continue to be the reserve currency, and our government bonds considered the safest by the rest of the world? If yes, we should be able to continue to expand our government debts. If no, losing that status will lead to a precipitous drop in the dollar and a severe spike in inflation, as we will then have the net, as it were, removed from beneath our mountain of debt. Who will roll over our debts when the rest of the world is selling it and our citizens don’t have either the inclination or money to cover these staggering debts? Of course, somebody will always buy government debt – at a cost. That cost would be tied, again, to spiking inflation. It gets ugly when a huge debt bill actually comes due and you can’t pay.
Notice I didn’t answer the question as to whether to expect the non-event in which we continue to grow the debt without immediate repercussion, or to expect dollar collapse. I’ve always said inflation was nearly impossible to predict, but losing reserve currency status would seem to be at least as hard to predict – in any year or even decade.
Personally, I expect something in-between the status quo and currency collapse for the dollar. While 60% of the nations in the world are trying to quickly disconnect their trade from the dollar, even if they did we would still have roughly 60% of total world trade done in US dollars. This is called the US & Europe (minus Russia), or two of the three largest economies in the world. So instead of a collapse, perhaps we will instead see a slow erosion of the dollar’s influence in maintaining our ability to increase government debt beyond the norm.
Conclusion & Investment Ramifications
My conclusion is that I still can’t predict the path of inflation! But if you take the best estimates of inflation, you see it appears too persistent, and too high, for consumers and the Fed.
This is bad news for stocks but good news for those invested in fixed income. It means the Fed won’t think of lowering rates again anytime soon. This is seriously bad for the stock market because investors have already baked-in several interest rate cuts in 2024 into their justification for soaring stock prices. This means they have driven prices higher based on the expectation rates would be falling by May. Oops.
While the status quo of no rate cuts is bad for stocks, it’s fine for bond investors receiving higher yields for longer. What isn’t fine for bonds is a continuing rise in inflation. If this should turn out to be a dreaded double-dip in which inflation goes up, comes back down and then returns with a vengeance, both stocks and bonds will suffer ala 2022.
We learned in 2022 that the only asset class (other than highly volatile commodities) which fully protected was managed futures. One of the other common hedges for inflation risk has traditionally been gold and silver. While not nearly as predictable as managed futures, Gold has risen 13.4% in the last year, and 8.7% this year, while our favorite gold/silver fund i.e. Sprott Physical Gold and Silver Trust (symbol CEF), has gained 8.5% over the last year and 7.15% so far this year (as of 4/2/24). If this is due to concern about inflation reducing purchasing power, this may be the start of a serious run for gold first – followed by an even bigger boost for silver.