
By Richard Morey
July 2023
 Let’s Follow the Money, Shall We?
Milton Friedman famously said, “Inflation is always and everywhere a monetary phenomenon in the sense that it is and can be produced only by a more rapid increase in the quantity of money than in output.” (Friedman,1970, p. 24.)
I located this quote in an article by John Williams, who is now the President of the Federal Reserve Bank of New York. In that article, written in 2012 and entitled Monetary Policy, Money, and Inflation, Mr. Williams seemed confident he and his Fed brethren could handle anything regarding inflation. Yet by 2021 he must have forgotten everything he thought he once knew on the topic. In July of 2021, right as inflation was beginning to jump, MarketWatch reported the following:
“Don’t panic about rising inflation in 2021. That’s the message delivered Monday by the president of the New York Federal Reserve.
John Williams, one of the top officials at the U.S. central bank, said he expects inflation will “run above” the Fed’s 2% target through the rest of the year.
Yet he also predicts inflation will subside to 2% by 2022 after the U.S. and world economies are mostly reopen and pent-up demand has largely been met.”
If keeping inflation under control is the Federal Reserve Board’s top job, how can we make sense out of Mr. Williams’ views in 2012 versus 2021? First, let’s assume he’s both intelligent and honestly did not want to be completely wrong on everything he said, wrote, and did about inflation in 2021.
To answer that question would require being in Mr. Williams’ head, but I suspect it’s due to the difference between writing a theoretical paper when inflation was near a record low and of little concern versus facing the real thing and having to make difficult decisions with confusing and incomplete data.
The good news is that inflation seems to be receding – though still a concern in some areas of the economy. The bad news is that the same Fed members who saw no inflation risk when it was catching fire may now overcompensate and keep their foot on the economy’s neck for too long.
Where is the Economy Now?

As with inflation, to understand the entire economy we need to again follow the money. The biggest flows of money from the government began with the CARES Act, passed in March of 2020, which distributed over $2 trillion. As it turned out, however, roughly half of that money was saved, i.e. not actually needed. Unfortunately, this little fact was ignored in March of 2021 when the American Rescue Plan was passed and signed for another $1.9 trillion – most of which was sent out to over 90% of our citizens. An even higher percentage of this money wasn’t needed by mid-2021 when the money arrived. All but the poorest saved this money – waiting for the economy to reopen and spending to resume.
Businesses were also showered with money, first in 2020 and now again in 2022 with the employee retention payments, i.e. gifts, of up to $26k per employee for those who didn’t lay off their workers during the pandemic.
Of course, most of the roughly $5 trillion in stimulus money was spent by last July, but the remaining $500 billion consumers have plus the new free money employers are receiving has been the fuel needed to keep the economy aloft – at least so far.
Does this mean the economy is growing like I hear on television?
Probably not – at least if you’ve heard the economy is picking up steam and doing well. The numbers clearly say the economy has been going nowhere for many months now. I think of it as the jet fuel of government stimulus money still pushing the economy up while interest rate increases and quantitative tightening are pushing it down. Combined, the economy appears to have essentially flatlined for the last year. This isn’t an opinion but is based on the following facts. Each of the following areas of the economy has shown no change for between 6 months to two years (all in real terms, i.e. adjusted for inflation):
From the broadest economic standpoint, the Atlanta Fed now shows 2nd quarter GDP coming in at 1.9%. This below-average growth is offset by a rare year-over-year drop in Gross Domestic Income, which measures the same thing as GDP. The Canadian economist David Rosenberg describes this as the twilight zone economy – we may not be in recession yet, but neither are we really growing.
The economy might appear to be going sideways, but underneath the hood it’s anything but calm. Many parts of the economy are dropping, while other parts appear positive due to inflation which is actually negative. Yet there has still been enough spending overall to keep us going – at least through the Fourth of July.
Watch the lags in monetary policy
This is one area in which people, from Fed economists to average investors, just don’t seem to believe or get it. The lag between rising interest rates and the full effect of economic tightening takes over a year to show up. The Fed began raising rates in March of 2022 and just ended in May of this year. However, as I write on July 6 the odds of another rate hike this month have now risen to 88%.
This means the economic headwinds caused by sharply rising interest rates in an over-indebted economy will continue to build for at least another  year. It’s beyond me to predict when the stimulus money will be fully exhausted and when the impact of rising rates, falling national income, and a dropping money supply will bring us clearly into recession.
But I can guess. If you just follow history, the average time from the first interest rate increase to the onset of recession is 17 months. We’re now entering month 16 – so my guess is the longest, strangest economic era in modern times will finally end this very summer.
What to Watch: CLOs
Since Covid I have said we would know when the “real” bear market for risk assets has arrived when the riskier areas of the bond market started to hemorrhage money. At that time, I recall saying the stock market momentum would break when junk bonds lost 10% or more. This happened in March of 2020, before the Fed took extraordinary measures to keep the bond market solvent and trading.
The fact is I was wrong to believe the junk bond market would tell us very much about other markets, and it’s not going to be the market in the news bringing other sectors down. This is due to the fact the high-yield market has moved up the scale in terms of quality, and unlike debt as a whole, their debt levels have actually grown at reasonable levels for the last decade.
Of course, depending on how severe and long the recession turns out to be, junk bonds will undoubtedly suffer losses. But this isn’t where we should watch to see the risk hitting early on.
For this, Collateralized Loan Obligations or CLOs are the place to watch. Unfortunately, we can’t really watch them in real time because they’re part of the Shadow Banking System and are therefore not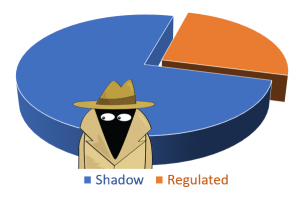 transparent. I know for a fact many of them consist of debt equally worthless to the CMOs which helped bring down banks during the mortgage crisis. They’re essentially identical, except in this case the CLOs are backed by loans to worthless companies while the CMOs were backed by worthless mortgages.
Thus far there has continued to be so much money in the shadow banking universe that the CLO market hasn’t yet had it’s day of reckoning. We’re talking about some unknown trillions of dollars of debt – much of which will end with a 100% loss due to being highly leveraged. That debt came from loans to companies – most of whom will be in bankruptcy the moment their loans come due.
I’ve only heard one person raise the alarm about what’s coming in terms of US debt, and that’s David Rosenberg. He recently said almost half of all US and private debts have to be refinanced in the next 24 months.
I’d already found some investment bank research showing $10 trillion of the roughly $42 trillion in shadow banking debt would have to be refinanced this year, but half of all our debt in 2 years made me take a gulp. The Fed has raised interest rates 5% since much of that debt was issued.
Who’s going to refinance it when so many of the corporate borrowers simply won’t have the resources? When the answer increasingly becomes “nobody,” we should be able to see this first by watching CLOs begin to go under. They may be hidden in the Shadow Banking world, but will suddenly become very visible at this point. That’s my answer to the question, “When will the fireworks expected in the next recession begin?”
The Stock Market & Corporate Profits Update
This will be quite short. The stock market is again at 1929 & 2000 levels of being over-priced. This year almost all the market’s gains have come from a few, huge tech stocks benefitting  from the AI craze. I say craze because it reminds me so much of the “.com” era in 1999 when a handful of huge tech stocks were again the kings of the market – and massively over-priced.
The fact is, every one of the tech bubble behemoths in 1999 was a great company, and almost all of them have been great companies ever since. This includes Microsoft, Intel, & Cisco, and most of the leading semiconductor companies of then and now. Yet all those whose prices had become far too high by early 2000 dropped from 75%-95% and stayed depressed for the next 20 years. This is the likely fate of, I’m afraid, stocks such as Facebook, Tesla, Alphabet (Google), Apple, Microsoft, Nvidia (in fact, once again, the entire semiconductor industry), plus a few others. The profitable companies with superior products and loyal customers will still be valuable over time, but when true bubbles finally end prices don’t recover for a very long time.
Yes, artificial intelligence has potentially huge, highly profitable possibilities. No, it’s a terrible time to chase imaginary future profits – far too early, at prices which began far too high, in an economic environment far too dark.
Corporate profits aren’t quite so hazy. According to FRED economic data at the St. Louis Fed, total corporate profits were $3.001 trillion in the second quarter of last year but had fallen 6% to $2.818 trillion by the end of last year. While this is their latest reading, looking at all the earnings reports since then shows the profit recession picking up steam.
Our Prediction
At the end of the day, we’ve always banked on reality in investing. Market participants can pretend everything looks good and risk has again, mysteriously or even magically I would say, disappeared. They can say this, and keep buying accordingly, but when profits fall 6% in six months, and then continue to fall further and faster – I’ll take that trend as my #1 near-term stock market predictor over fantasies of AI treasure any day.
Even better is to lean on the indicators followed by the best managed futures funds, as they have the rare ability to hold steady or, sometimes, profit short-term from rising stocks – even when stocks are at risk longer-term and they are ready to profit from a fall.
As alluded to in this short report, I also predict we will soon have a debt liquidation event whose losses will first appear in Collateralized Loan Obligations before spreading throughout the shadow banking system. This will most likely appear a month or two before we have an officially recognized recession. Alternatively, we could have more regional banks go under due to bad commercial real estate. Collateralized packages of commercial real estate mortgage (the same as CMO & CLOs) will amplify the coming losses from this sector.
Conclusion
The broadest measures of the economy show us stuck at little to no growth since inflation kicked into high gear in mid to late 2021. Yes, GDP has been running a little above or below 2% – anemic but growth. However, the equally valid measure of the economy called Gross Domestic Income is now down year-over-year – something that rarely occurs and never outside recessions.
Put it together and we get an economy still growing in some areas but stumbling in others. This makes sense given the bout of inflation we are, hopefully, beginning to get over.
The biggest risk going forward is that the government stimulus money is definitely running out this year, while the Fed has rates set 5.25% higher in an economy with record corporate debt that is now starting to need to be refinanced in the trillions.