

In this report we’re first going to present a case that the bear market for stocks is now over. From this view the bear market was short and a little scary, but it’s behind us now. We’ll then analyze this thesis using the reported data, context, and some common sense.
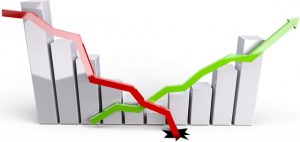
Here’s a recap of last month through the big jump in the stock market yesterday (all numbers through 8/2). Momentum of almost all assets continued moving in the exact opposite direction in July, which was of course a huge change in direction that began June 15. Everything that had gone up the first five months of the year went down, while the asset classes that suffered in the first half rebounded.
For example, the S&P 500 stock index fell 20.5% from January 1 through June 30 but has since gained 9.8%. This gives it a year-to-date loss of 12.2%. The recent bounce in stocks was to be expected. In fact, a bounce-back was not only expected but, at some point(s), a near certainty. During both the 2000-2002 and 2007-2009 bear markets, stocks rose approximately 10% or more 8 times in each downturn. I’m afraid investors will need to get used to these types of wild swings for the next year to eighteen months.
If you analyze the amount of time it takes for markets to resume falling after rebounding during a bear market, you see these trend changes tend to be short-lived. In the dot.com crash, for example, over half the 8 rebounds ended in two to four weeks, with the longest lasting two and a half months. Our current reversal/rebound for stocks has now lasted just over 6 weeks. Again, this was to be expected.
In the dot.com crash the NASDAQ index went down for 2 ½ years before bottoming out with an 82% loss in 2002. I’m fairly optimistic our entire stock market won’t fall that much by the time this is over – hopefully sometime next year.
The Case for a New Bull Market for Stocks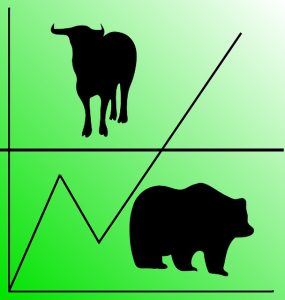
Stock market momentum doesn’t go up entirely on its own. Instead, the entire financial media creates a narrative to justify the recent rise and give evidence as to why it may continue indefinitely. Below is a summary of what these optimistic analysts say is now going on – in the economy and the stock market.
The broad view in the financial media is that it’s now looking like we may avoid a recession. The Fed has raised rates another .75% and we appear to be taking it in stride. Plus – and this is the key – they now hint we may just get another .50% increase in September. At the very least, the Fed let slip they’re flexible on this topic. Then for all we know they’ll be able to stop raising rates without having tipped the economy into recession.
Looking at the data, it appears inflation may be cooling off fairly seriously. This could easily lead to the Fed stopping with one more increase, or two at most. Then if the inflation caused too much damage and the economy begins to stall out, the Fed will be able to loosen again and we’ll be back on track with no recession.
Bolstering this case are all the signs now pointing towards inflation going down from here. By the time the Fed is done raising rates it might hit 3.5%. This will give them breathing room to start lowering them again to make sure any recession is short and mild. Either way, it looks good for stocks.
When earnings season began, we all heard  how it might show a dramatic slowdown, but the opposite occurred. 209 of the 278 companies in the S&P 500 who have reported met or exceeded estimates – that’s 75% which is pretty good and much better than expected.
Did we mention the strong labor market? Here is a headline from the New York Times on July 8: US economy adds 372K jobs in June despite recession fears. Then the number for July came out this morning showing an increase of a whopping 528,000 new jobs. As one of our colleagues said on tv this morning, there has never been a recession with booming employment growth.
Some Inconvenient Data
The bull market case is based on perceptions of the Fed, inflation, employment, and corporate earnings. The picture immediately gets murky because most of the inflation data now supports their bull market thesis. Any confusion is then amplified by two distortions in the bull case. Most important is all the data left out.
When we peruse the actual data, the picture it reveals bears little relationship to the entire bull market thesis:
GDP
The broadest measure of the economy fell in both the first and second quarters of this year (-1.6% & -.9%). While it’s true back-to-back negative GDP prints aren’t a technical definition of recession (which is a broad, sustained decline in economic activity), every recession has included two of them.
Here are the specific factors the NBER uses to flag recessions:
- Real personal income minus government transfer payments – has gone down the last 3 months
- Industrial production – has gone down the last 3 months
- Employment (household survey) – has gone down the last 5 months.
This is one of the two distortions commonly used to hide economic problems. There are 2 employment measures – the Bureau of Labor Statistics computes both a household survey and the payroll survey. The payroll survey includes something called business “birth-death” rates in which they randomly add or subtract hundreds of thousands of jobs based on data-free guesses about how many new businesses opened versus closed in any given month. It’s an unscientific farce.
 Not surprisingly, the payroll survey tends to mistakenly include employees in alleged new businesses that don’t even exist. This mistake skyrockets whenever a recession looms. In times of transition to recession, the payroll survey reports hundreds of thousands of non-existent jobs. It typically shows some of its largest growth during the first few months of every recession.
For example, over the last 5 months the payroll survey showed strong employment growth of 1,680,000 jobs. The household survey showed a loss of 168,000 jobs during the exact same time period. Nine months from now, I predict their final calculations will show the household survey was overly optimistic.
- Manufacturing – The ISM Manufacturing index has gone down each of the last 2 months and 4 out of the last 5.
- Orders & Inventories – Growth corresponds to expanding orders relative to inventories.
This relationship has now been deteriorating for five months. We have far too much inventory relative to orders for more goods to be produced. This ratio is now at the lowest level since March of 2020.
You may have never heard of this metric, but we have been plummeting to recession levels all year. It’s worth noting we have been in recession every time the orders to inventories ratio fell .85 or below over the last 60 years. We ended July at .838.
- Consumer Spending

The bull case for the economy & stock market hasn’t been talking about consumer spending much this year. For the year, spending has risen a total of less than 1% (.0716%).
While not yet going negative, the composition of spending has shifted dramatically to food and gas and away from everything else. This has negative ramifications for corporate America. It means even when consumers manage to spend the same amount of money, the sales and therefore profits shift to a small section of the economy.
Did we mention employment has gone down over the last 5 months?
A Note on Corporate Earnings
This is the other area where carefully crafted distortions are used to mask problems. Companies lower their earnings estimates shortly before they report them. Surprise, surprise, they almost always beat the low bars they set.
While we won’t know the actual earnings versus previous performance for some time, the fact is this part of the bull story is valid to a certain extent. Earnings last quarter were better than anyone expected.
To focus on one quarter’s earnings misses two important points:
1. Certain bellwether company CEO’s described dire warnings for earnings going forward in their quarterly announcements. Intel’s CEO warned of a huge economic contraction, as this is what is occurring in semiconductors right now. The CEO of AMD agrees.
Semiconductors lead the way up or down due to the fact their product is used in so many other products.
Wal-Mart is another leading company sounding warning bells. In their case they found consumers are now getting tapped out and are buying less of everything except food and gas. Proctor & Gamble and McDonald’s CEOs see comparable tightening in consumer spending habits.
2. Corporate earnings often hold up reasonably well in the beginning of a recession. First growth slows – which has already occurred – then it turns negative.
Inflation
This is the other area the bulls are excited about, as if inflation cools off the Fed won’t have to keep raising rates. Could this mean we avoid a recession? As mentioned above, many key inflation inputs are indeed cooling. For example: